Please note that csvplot source code is now moved to GitHub. Source code can be downloaded from the project’s GitHub page.
Purpose
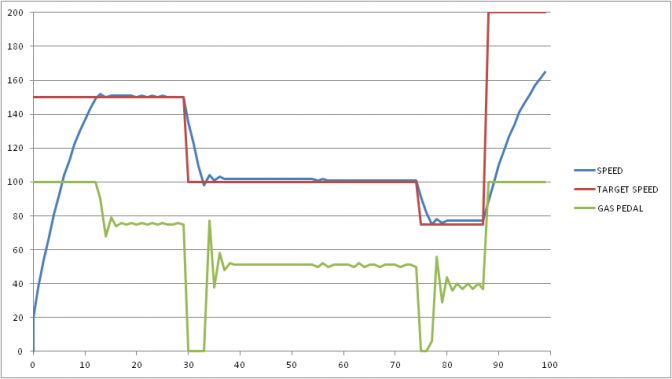
I do software prototyping using a wide range of programming language. I often have to generate data that changes over time which is mostly displayed in a grid format. However, that’s not the best way to understand how the data changes over time compared to plotting the data to a graph.
Most programming language I know does not offer a native library for plotting data to a graph. It is not an easy task. Most programming language often require external libraries for implementing the process and each library does not work the same way.
Excel is a native platform for parsing Comma-separated values (CSV) files and can be scripted to plot the result into an image.
The purpose of this script is to allows any programming language which generates data to plot the data into an image by saving the raw data to a CSV file and then using the power of Excel to plot the result into an image.
Keep reading csvplot – A command line script which uses Microsoft Excel to plot a graph from a Comma-separated values (CSV) file ?


